What’s the number one go to value for “design” a wireless network? If you ask most people they will say RSSI. Received Signal Strength Indicator, or RSSI, is the quickest way to see if you have coverage. It’s the “four bars” approach to wireless design, but it isn’t anywhere close to designing a working network. RSSI is a non-standard calculated value and it is highly dependent upon the client adapter being used.
Long ago…
Long ago designing networks was simply about providing coverage, not capacity. As long as you had a signal you probably were able to reach the intended services you were trying to. Now we focus more on capacity, but in order to have capacity we need to first achieve or physical requirements. We look at what our Primary RSSI and Secondary RSSI need to be, if we are designing for Cisco Voice as an example we are looking for a Primary & Secondary of -67dBm, then we add into that the SNR of 25dB, and finally factor in our CCI/ACI.
What did you survey with?
When you did your predictive design you were looking for those values to be met. Now you are onsite and looking at doing either the APoS or Validation Survey and are using your survey adapters. These survey adapters might be a Proxim 8494 (Ekahau NIC-300) or maybe an Ekahau Sidekick these days. You now have a view of the network from that devices perspective, not your client device. So what do you do? Can you do anything?
Device offsets?
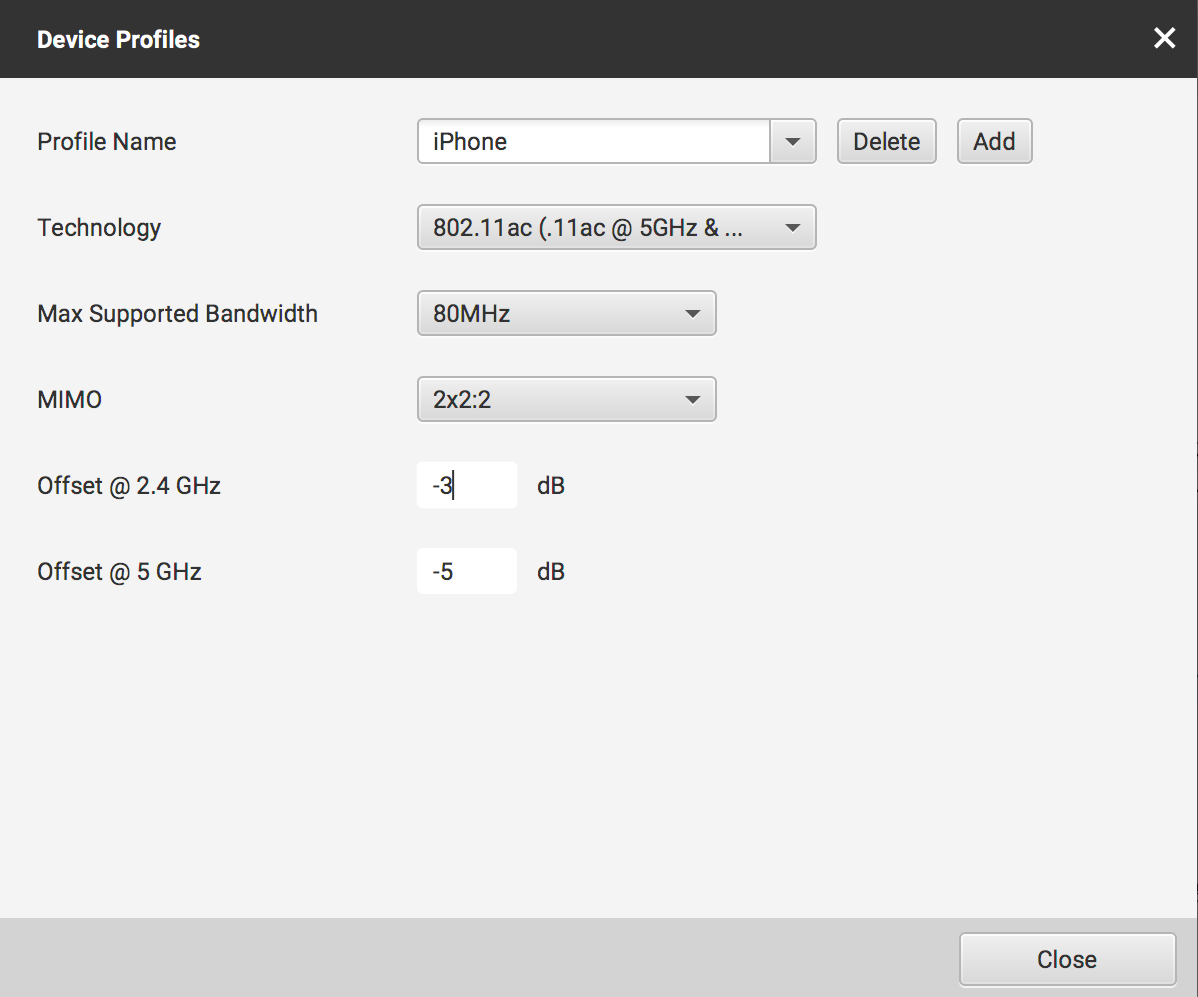
For many the desire is to make their survey data reflect how the end device would see the signal, not the survey device. Many applications have added different ways of doing this and I want to discuss the way that Ekahau recently added to their software. In 9.x Ekahau has added the ability to create a “Device offset” under the Device Profiles menu option.
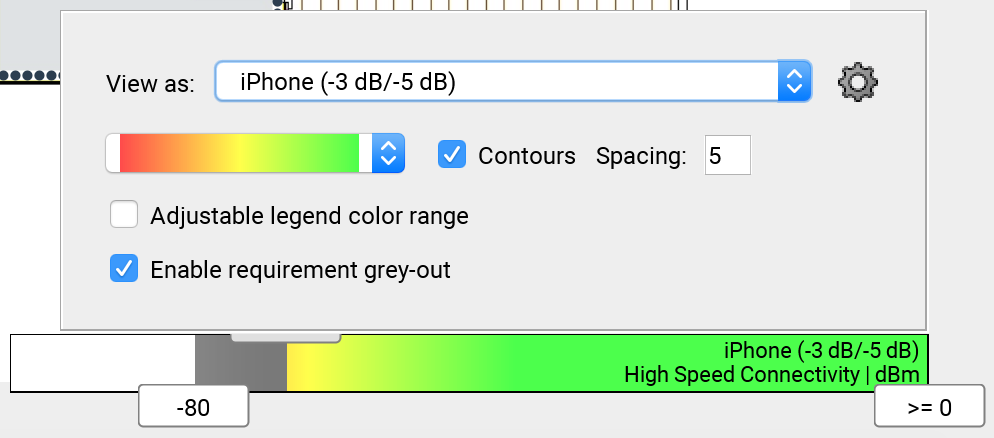
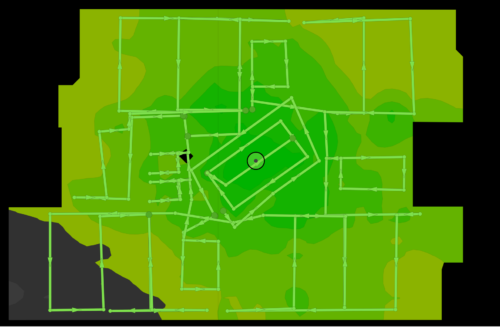
Normally one would be creating these devices to be used in the SLA and capacity planning but now once you add the offset you can visualize the data as that device. This is done by clicking the visualization legend using a key modifier (depends on OS and version, either CTRL or CMD or ALT) and selecting the device you want to visualize the data as.
So now we can visualize the data with that offset that you defined. Sounds kind of cool doesn’t it? Well you should be slightly concerned about using the feature and here is why: what device offset do you use?
Not Calibrated!
Client devices are not calibrated, they are not sent to a NIST laboratory or similar and tested for RSSI tolerance and accuracy. We don’t send these devices back each year to get re-validated. We accept that the devices are hopefully at least consistent, but the reality is they are not! Our trusty tried and true survey adapter the Proxim 8494 has been known to have a 10-15dB variance in the readings. The Ekahau Sidekick is promised as a consistent device compared to the gold masters at the factories, again consistent device not calibrated device. So how do you know what the value of the offset is for an iPhone or Pixel2?
RSSI|COMPARED
Launching today is RSSI|COMPARED which is a crowdsource application with the intent of determining the offset ranges for various devices out there using a consistent testing process. 
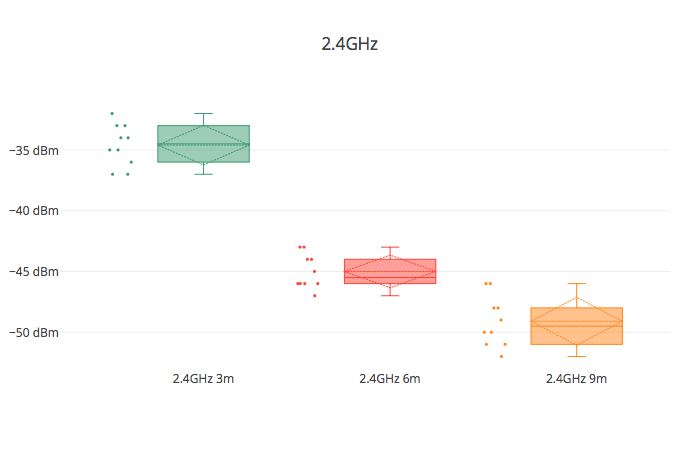
Using the test setup above with an AP and client device at the same height with 3 different Free Space Path Loss (FSPL) distances between the two the data will be statistically compared providing a min, max, mean, median, and standard deviation. This will allow you to see what the range of values could be and then you can select what you would like to show.
But the test isn’t real world! The AP isn’t mounted to the ceiling, it’s upside down on a table! Yup, that it is. I originally had planned on having the AP be mounted or on a temporary solution like you do with an APoS but during testing it was decided that wasn’t necessary and we wanted to make the test more accessible to folks to perform on their own.
The goal is two parts: a) show how inconsistent devices are and b) provide a realistic range that you can use. Ultimately though the question comes down to should you be “compensating” your data to visually represent it as something it isn’t or should you just understand what the differences are to begin with between your survey adapters and client devices allowing you to adjust your design accordingly?

Excellent article Blake. I have been fighting this battle for a while At the company I work for. We will do a Survey with the proxim cards, but I know our device sees the network differently then the proxim cards. This article will help to figure out the difference between the two.
Thanks again